CoralDuck is a rebuild
of Coral, a cohort analysis tool that
runs on a curated database. In contrast,
CoralDuck runs the
database in your browser tab instead, providing a similar experience for your data.
What it is, and where it came from
Coral is designed for server-hosted, curated clinical data—users log in to query hosted
datasets via Postgres while managing cohort creation, characterization, and provenance
in one place. Its server infrastructure enables features like session management,
sharing analyses states, and extended provenance tracking.
CoralDuck is a
serverless alternative. It retains Coral's core analysis workflow, layout, and
terminology, but runs DuckDB in your browser for local data analysis. Your files stay
entirely on your device for local-only analysis.
The design, the workflow, and most of the gestures here are based on Coral.
News
v1.2.0
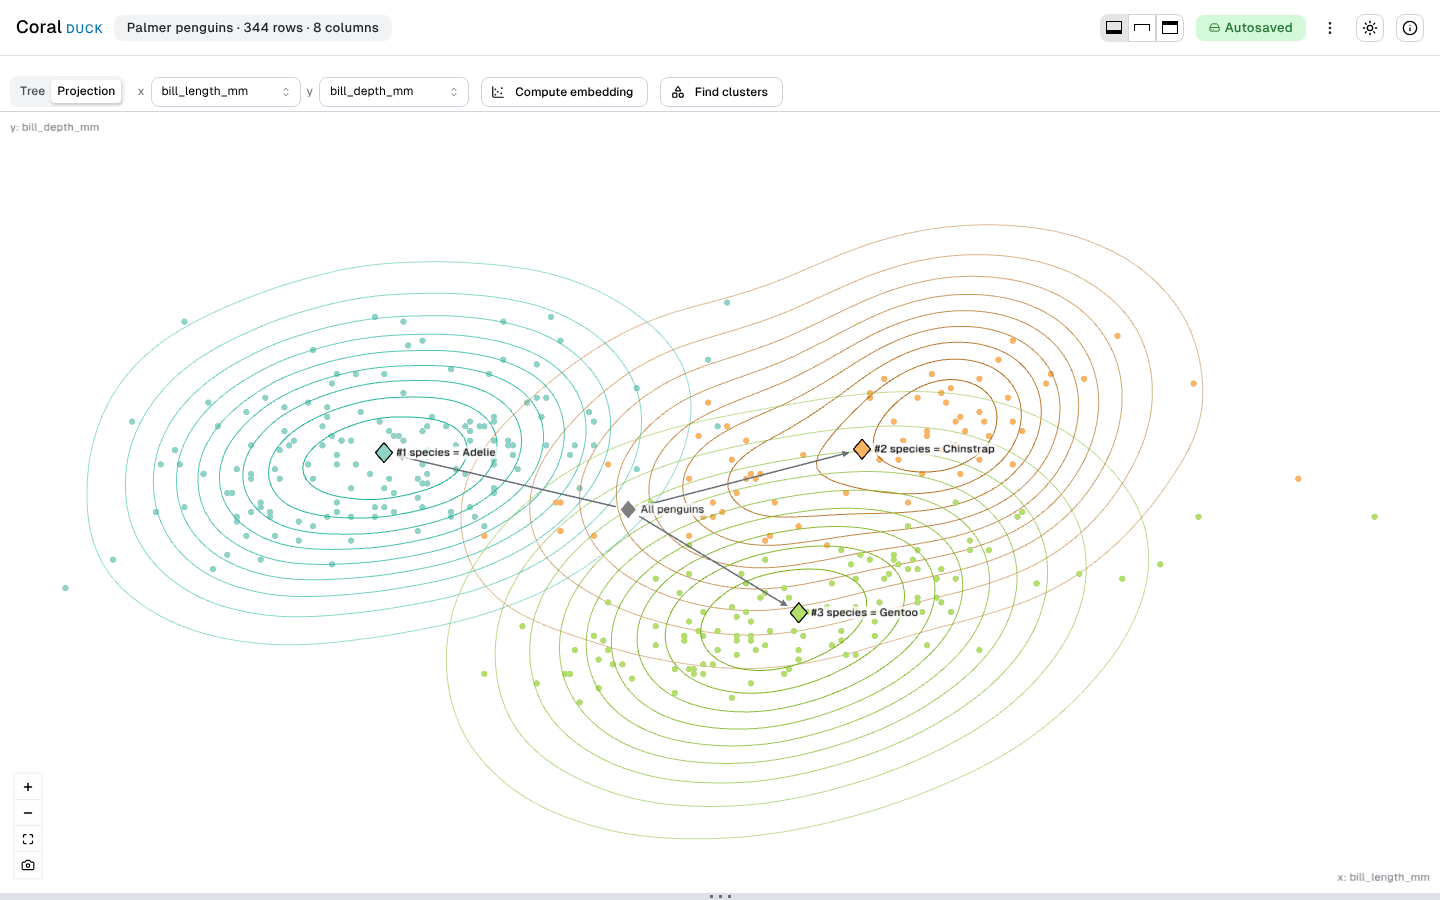
Projection: your cohorts on a map 🗺️
The Overview has a second layout beside the tree. Every row is a point on two
coordinates of your data, and every cohort is a diamond at the mean of its rows,
joined by the tree’s edges. Coral had only the tree; the projection layout
follows Eckelt et al. 2023.
Bring coordinates, or compute them. Pick any two numeric columns,
or run UMAP in your browser. The embedding is seeded, so the same attributes draw
the same map every time, and a large table is fitted on a sample of 50,000 rows.
The projection layout
Three species on two of their measurements
Cut a cohort with a lasso. Drag around the rows you want, and
“Filter by lasso” opens Filter with it for every selected cohort, so the
new cohort is still confirmed in the action view.
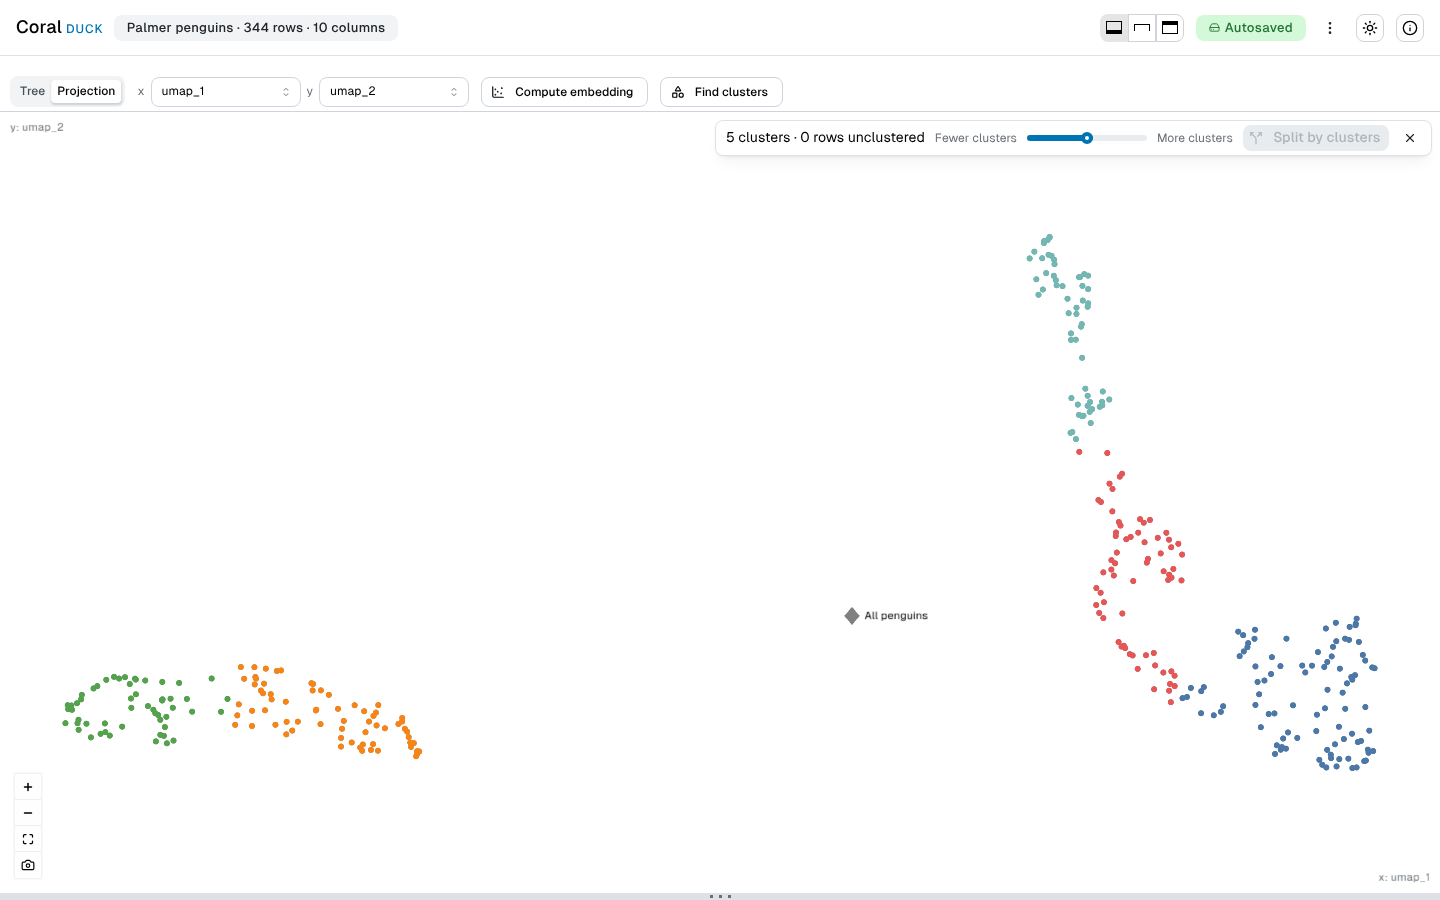
Clusters become cohorts. “Find clusters” colors the map
by its dense regions, one knob sets how many there are, and “Split by
clusters” hands them to Split.
Clusters in a computed embedding
Colored by cluster, ready for Split
Computed columns travel with your work. The embedding and the
clusters are new columns, marked as computed. They come back on a reload, and
“Export derived values” writes them to a file that goes beside the
project file.
Pick two or more cohorts, and a random forest ranks the attributes that tell them
apart. It is Coral’s Kokiri operation, ported to fully run in your browser.
Kokiri’s approach, extended. Each attribute is confirmed,
tentative or rejected against a shuffled copy of itself, instead of being cut at a
fixed threshold. Accuracy is out-of-bag: each row is predicted only by trees that
did not train on it. Each tree draws its rows without replacement, which removes a
known bias in the importance and serves small cohorts better. Stop keeps the forest
grown so far, and Exclude and Limit start a narrower run.
Characterize, one finished run
Importance, accuracy and the items
Parquet and JSON load, and both row exports can write Parquet.
Shareable links. A link can open the app with a dataset already
loaded, so you can send one to a colleague.
Session management. Each tab keeps its own saved session, and the
Welcome screen lists the others to continue or delete.
CoralDuck reaches v1
as a browser-only tool. Coral’s workflow is here — the cohort tree, the
three-area action view, filter and split, prevalence, compare, and the item table
— running against an uploaded dataset rather than a database.
What that changed, in the places you will notice it:
You bring the data. CSV and TSV, plain or gzipped, from your disk
or a URL.
Nothing is uploaded, and nothing is fetched. No login, no session
on a server, and no third-party request from this site or from the app.
Prevalence gets a better confidence interval: Agresti-Coull instead
of Wald, which is too narrow when a cohort is small or its rate is close to 0% or
100%. The reference is any subset of the cohort’s own steps.
Two row exports instead of one, plus a PNG of the whole tree, and a
portable project file that carries an analysis between machines.
A color scheme you choose — light, dark or system —
across the app and this site.
Compare shows one card per attribute instead of one large matrix.
Each cell names its real statistic (Cramér’s V, or a rank-biserial
effect size) and says which cohort is higher and how much the two overlap.
Compare, one cell open
The test, the score and the effect
Not here yet: Characterize, the projection view, and the onboarding tooltips.
Full changes.
Publications
Coral, the components it grew out of, and the work its projection layout follows are
described in these papers. There is no
CoralDuck paper; if it
helps with something you publish, the Coral paper is the one to cite.
Coral: a web-based visual analysis tool for creating and characterizing
cohorts.Patrick Adelberger, Klaus Eckelt, Markus J. Bauer, Marc Streit, Christian
Haslinger, Thomas Zichner.Bioinformatics, 2021.
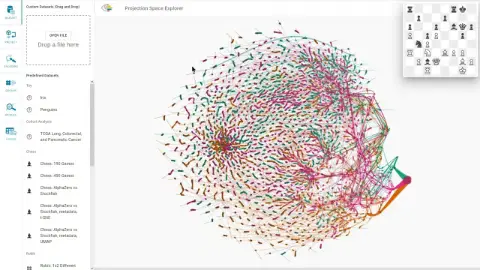
Visual Exploration of Relationships and Structure in Low-Dimensional
Embeddings.Klaus Eckelt, Andreas Hinterreiter, Patrick Adelberger, Conny Walchshofer,
Vaishali Dhanoa, Christina Humer, Moritz Heckmann, Christian A. Steinparz, Marc
Streit.IEEE Transactions on Visualization and Computer Graphics,
29(7):3312–3326, 2023.
Kokiri: Random-Forest-Based Comparison and Characterization of Cohorts.Klaus Eckelt, Patrick Adelberger, Markus J. Bauer, Thomas Zichner, Marc
Streit.IEEE VIS Workshop on Visualization in Biomedical AI, 2022.
TourDino: A Support View for Confirming Patterns in Tabular Data.Klaus Eckelt, Patrick Adelberger, Thomas Zichner, Andreas Wernitznig, Marc
Streit.EuroVis Workshop on Visual Analytics (EuroVA ’19), 2019.
The source is at
github.com/keckelt/coralduck, along
with every decision that shaped it — the architecture records in
docs/adr/ are the real documentation. Bugs, questions and requests belong
in the issue tracker.
CoralDuck computes
statistics on data it has never seen, and its p-values are not corrected for multiple
comparisons. It is not for the provision of medical advice.